

Xient Bridge
Charts from SAP. In the chat. On request.
No BI project, no story, no export: you ask "as a bar chart" and Bridge draws it - live from SAP, with key figures on top and the source below.
Why this is more than a chatbot.
A chatbot answers with text. Bridge answers with whatever the question needs: a table with totals, three key figures, a chart. "Show the contracts with the highest target value" becomes a bar chart, "stock per plant" a grouped bar with available stock and open order quantity, "how has the price developed" a line drawn from thirty price records.
And because it comes live from SAP, the chart is as current as the document - not as old as the last load into the warehouse.
What that means for controlling and procurement.
See figures early instead of explaining them late: discount deadlines, payment terms, expiring contracts visible while they can still be acted on. Ad-hoc questions without a report request to IT. And for the afternoon presentation: the chart from the chat, no detour.
The same rules as everywhere in Bridge: only approved queries, only under your permissions, nothing copied, nothing written.
This is what it looks like.
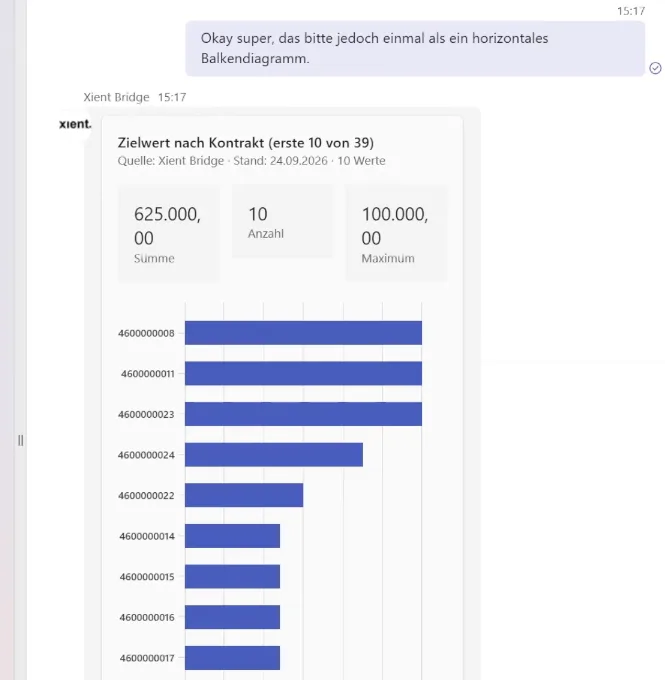
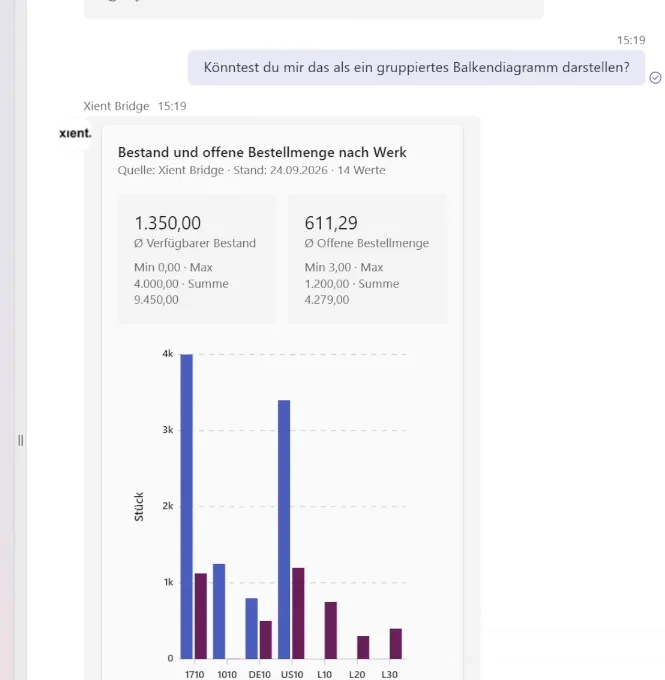
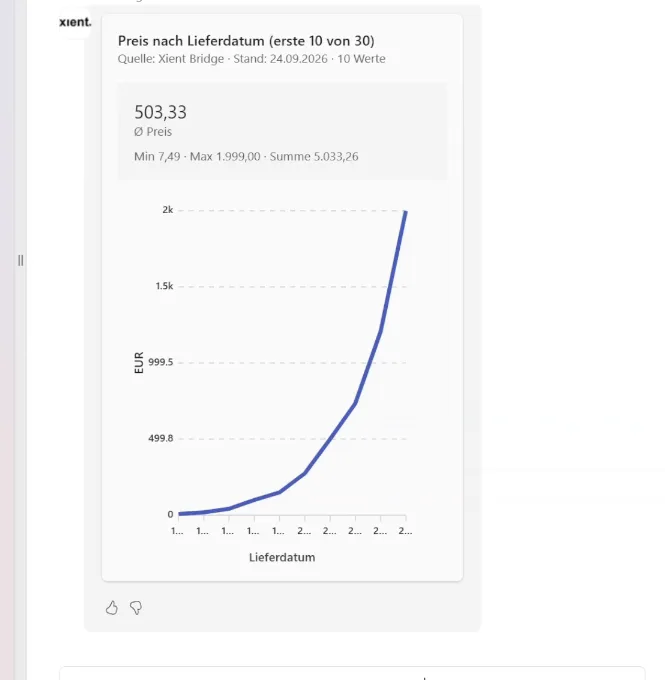
Stills from the demo videos, recorded in a demo system.
Common questions
Which chart types are available?
Bar, horizontal bar, grouped bar, line, donut - plus tables with totals and key figure cards.
Where does the chart data come from?
Live from your SAP, through the same approved interfaces as every other Bridge answer. No data copy, no warehouse required.
Does this replace our BI tool?
No. Bridge answers the question at the moment it is asked. Your BI remains the place for reports, history and distribution.
Can I share the chart?
As an image from the chat today; export to PDF and presentations is in the works.
See charts from SAP live.
Thirty minutes, your questions, a real demo system.